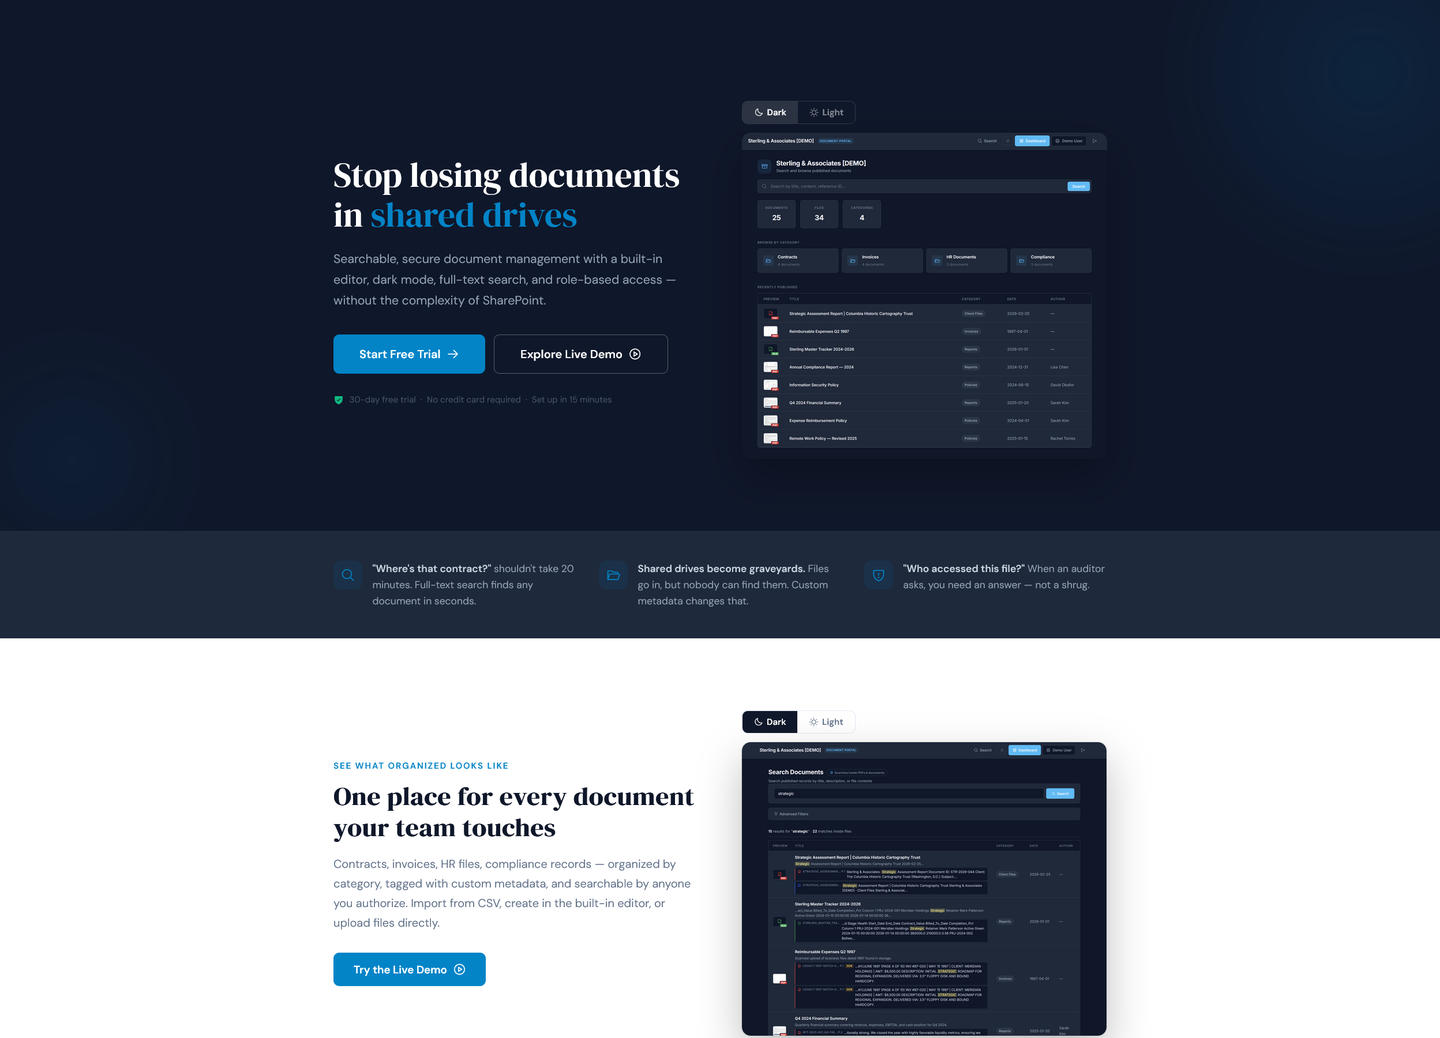
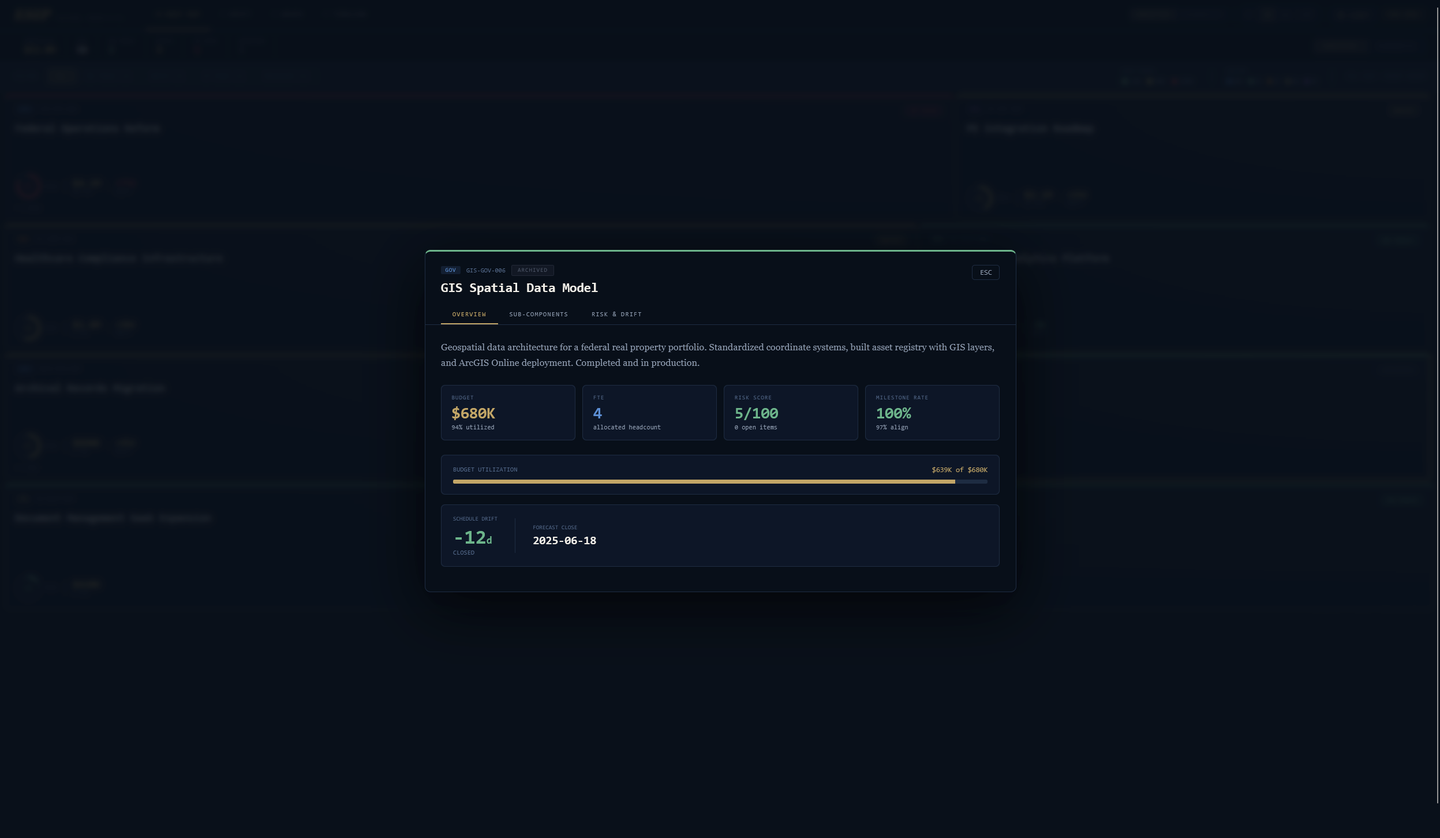
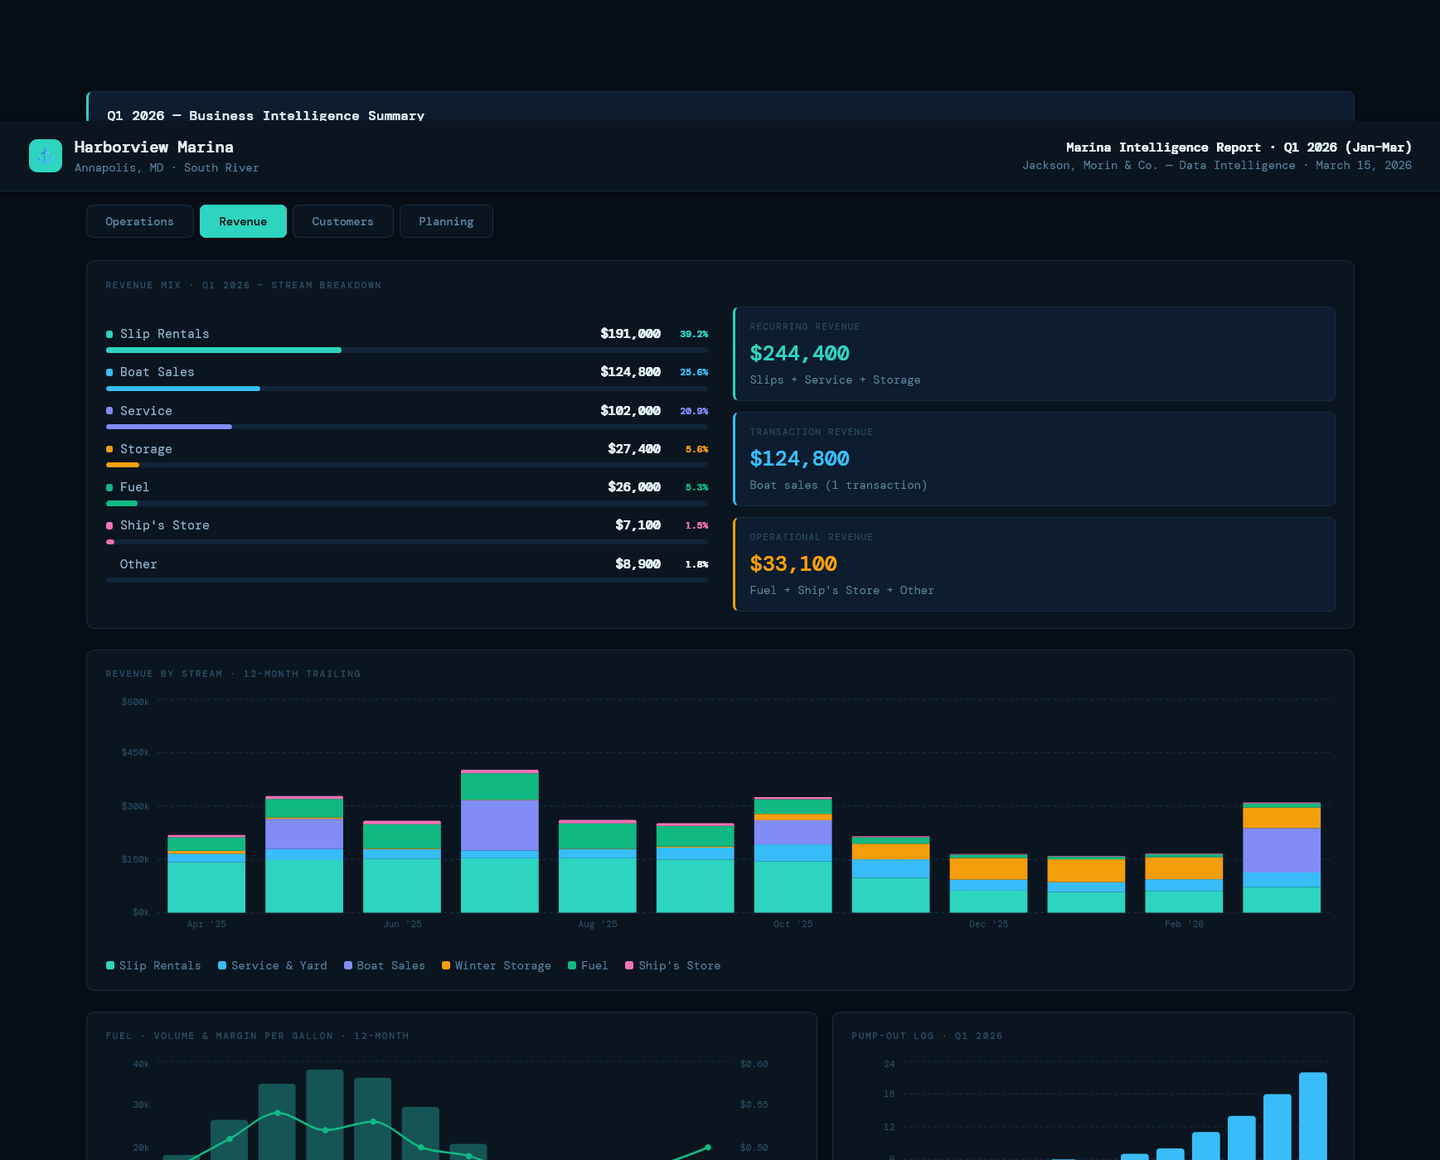
Eight dashboards. Seven industries. Built before the first call.
Aviation, marina operations, waterfront analytics, CRE portfolio, fleet management, helicopter operations — each dashboard is built for a specific business using their actual data model. Drag or click to explore each layer.
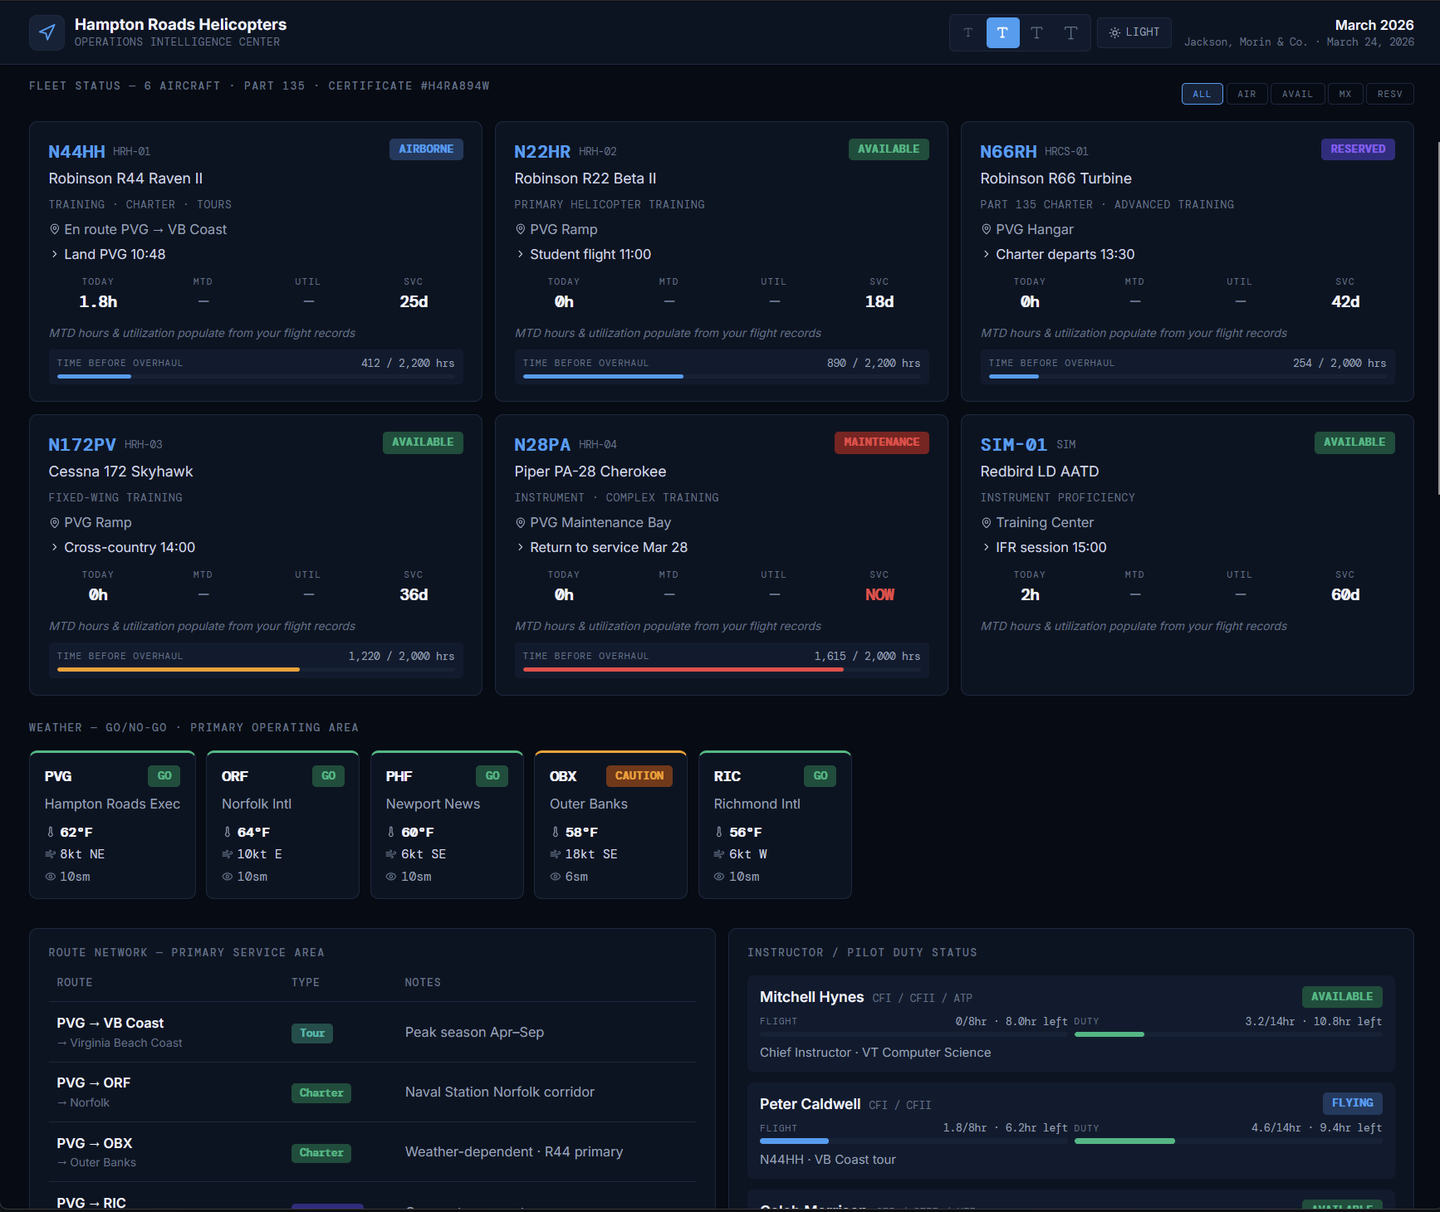
HRH Operations Dashboard
An operations intelligence center built specifically for Hampton Roads Helicopters in Chesapeake, VA. Their actual aircraft (R44, R22, R66, C172, PA-28, Redbird sim), their instructors by name, their maintenance schedule, their route network. Fleet status with TBO tracking, weather go/no-go strip, instructor duty hours, revenue by service line, charter booking heatmap, and strategic analyst insights. Built before the first conversation as a demonstration of the spec-build model.
This is what your data
looks like when it works.
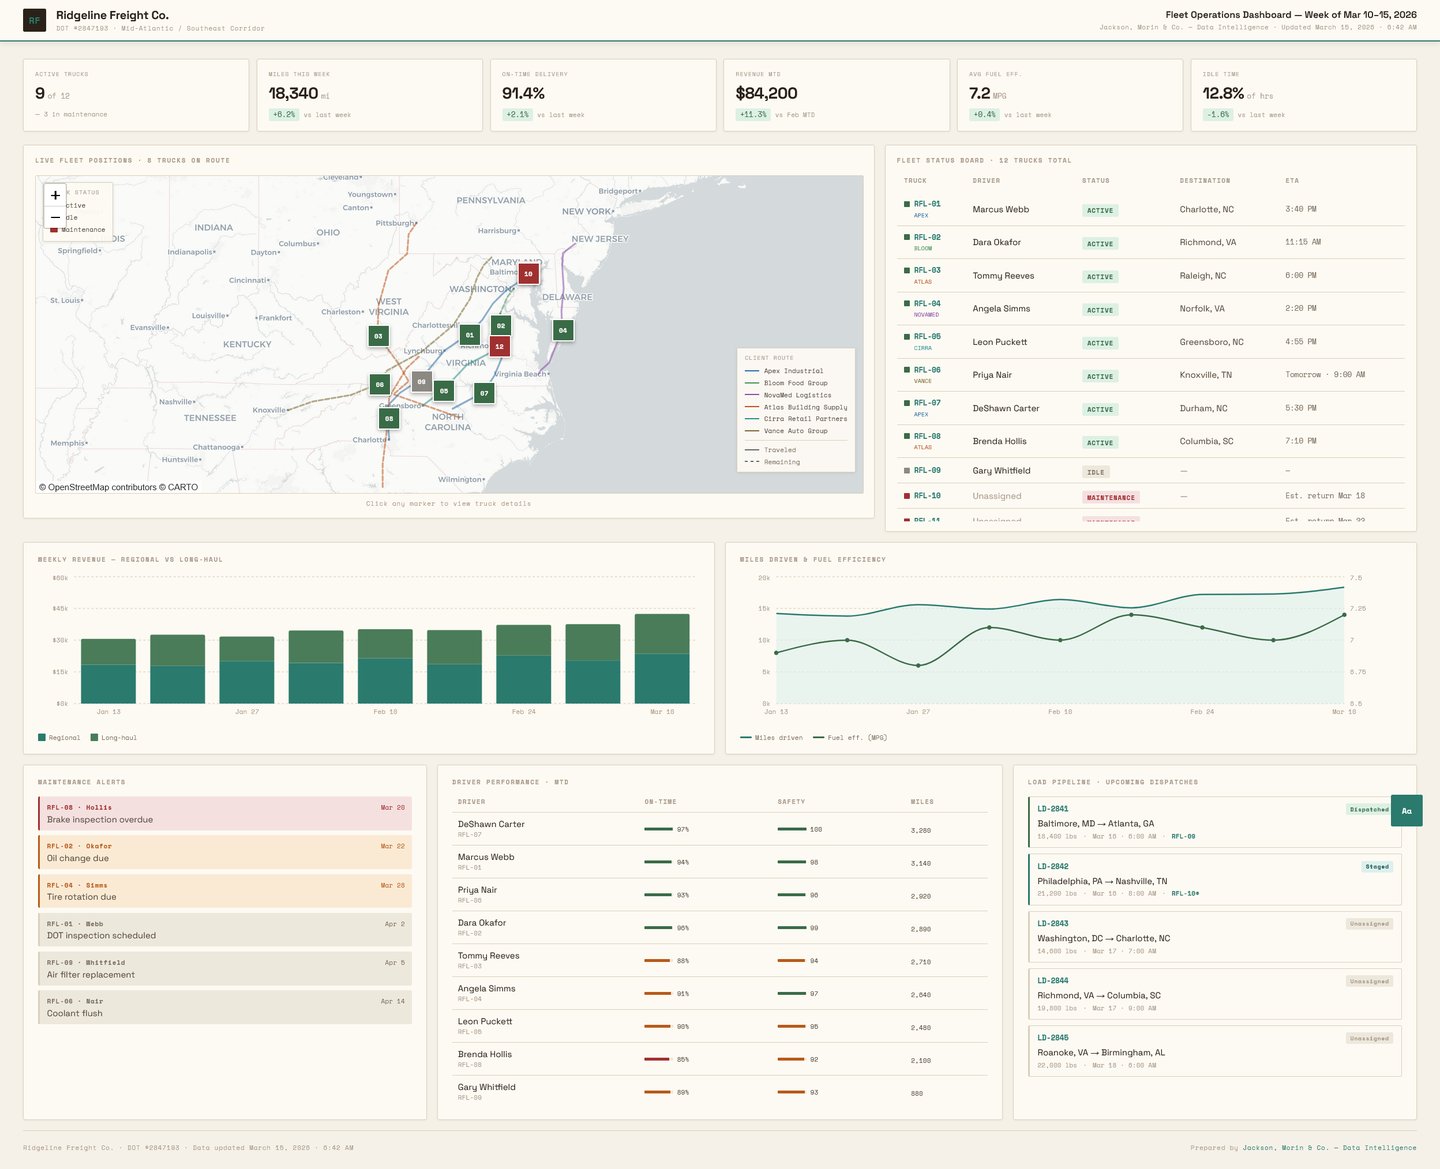
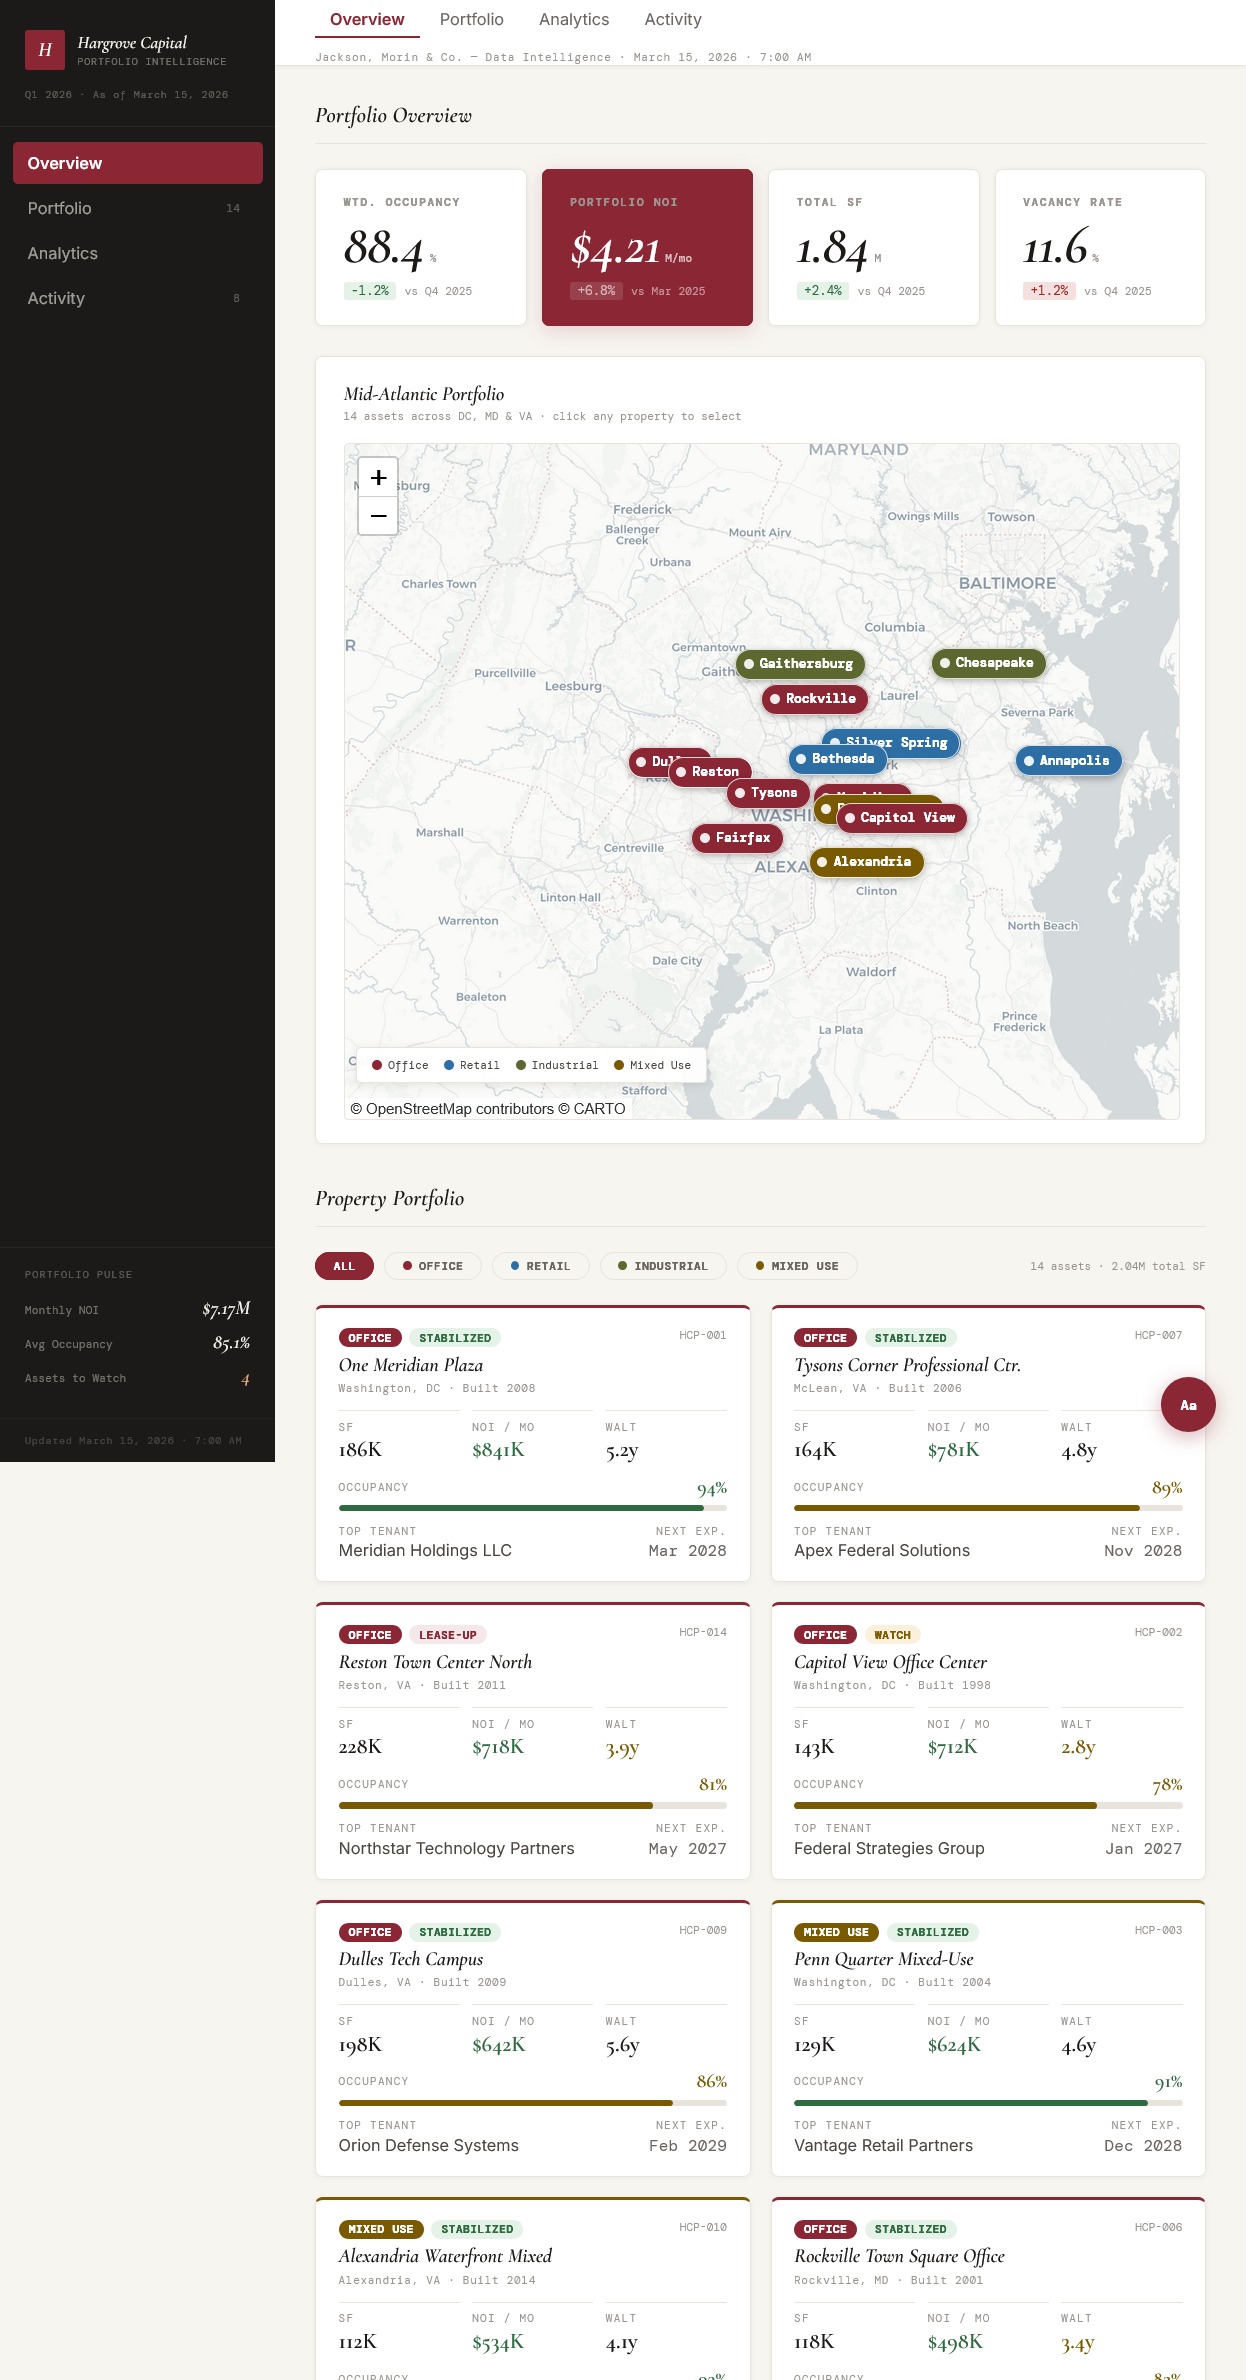
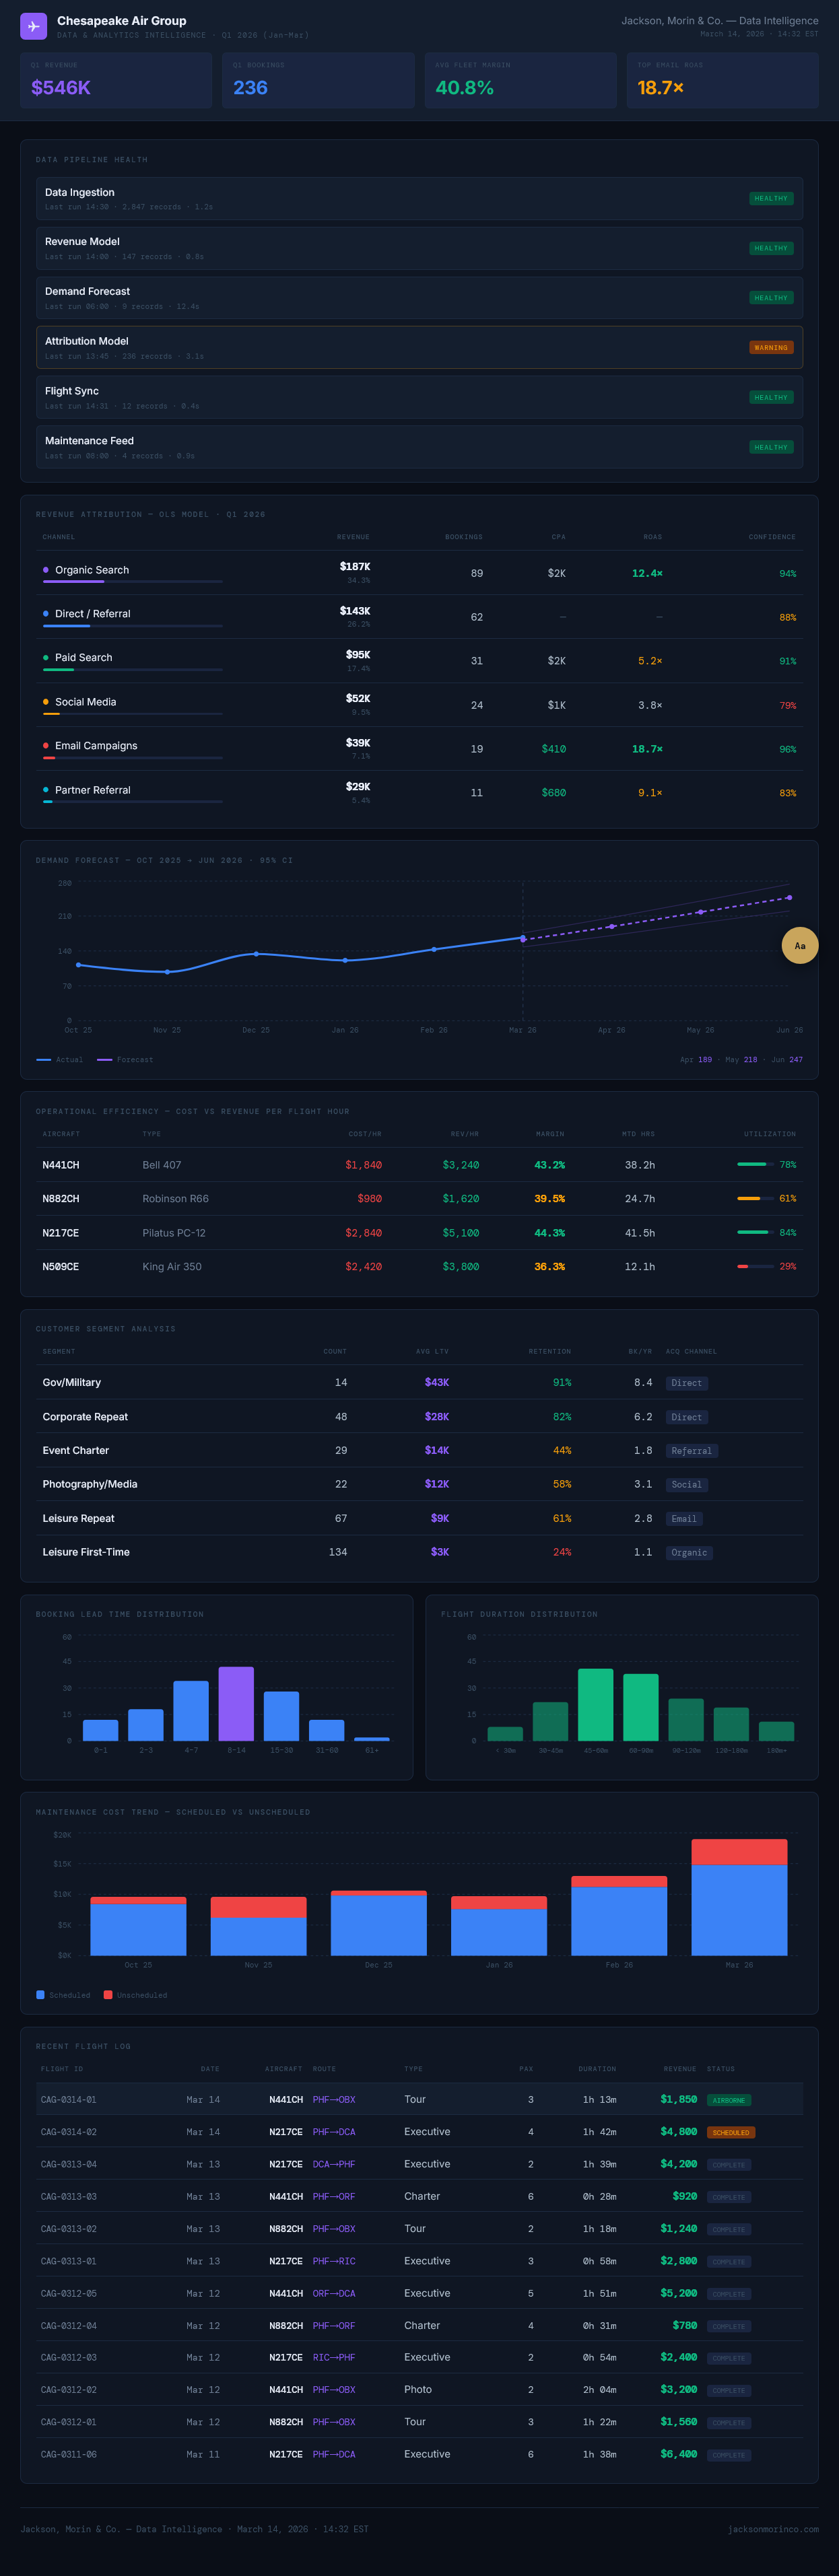
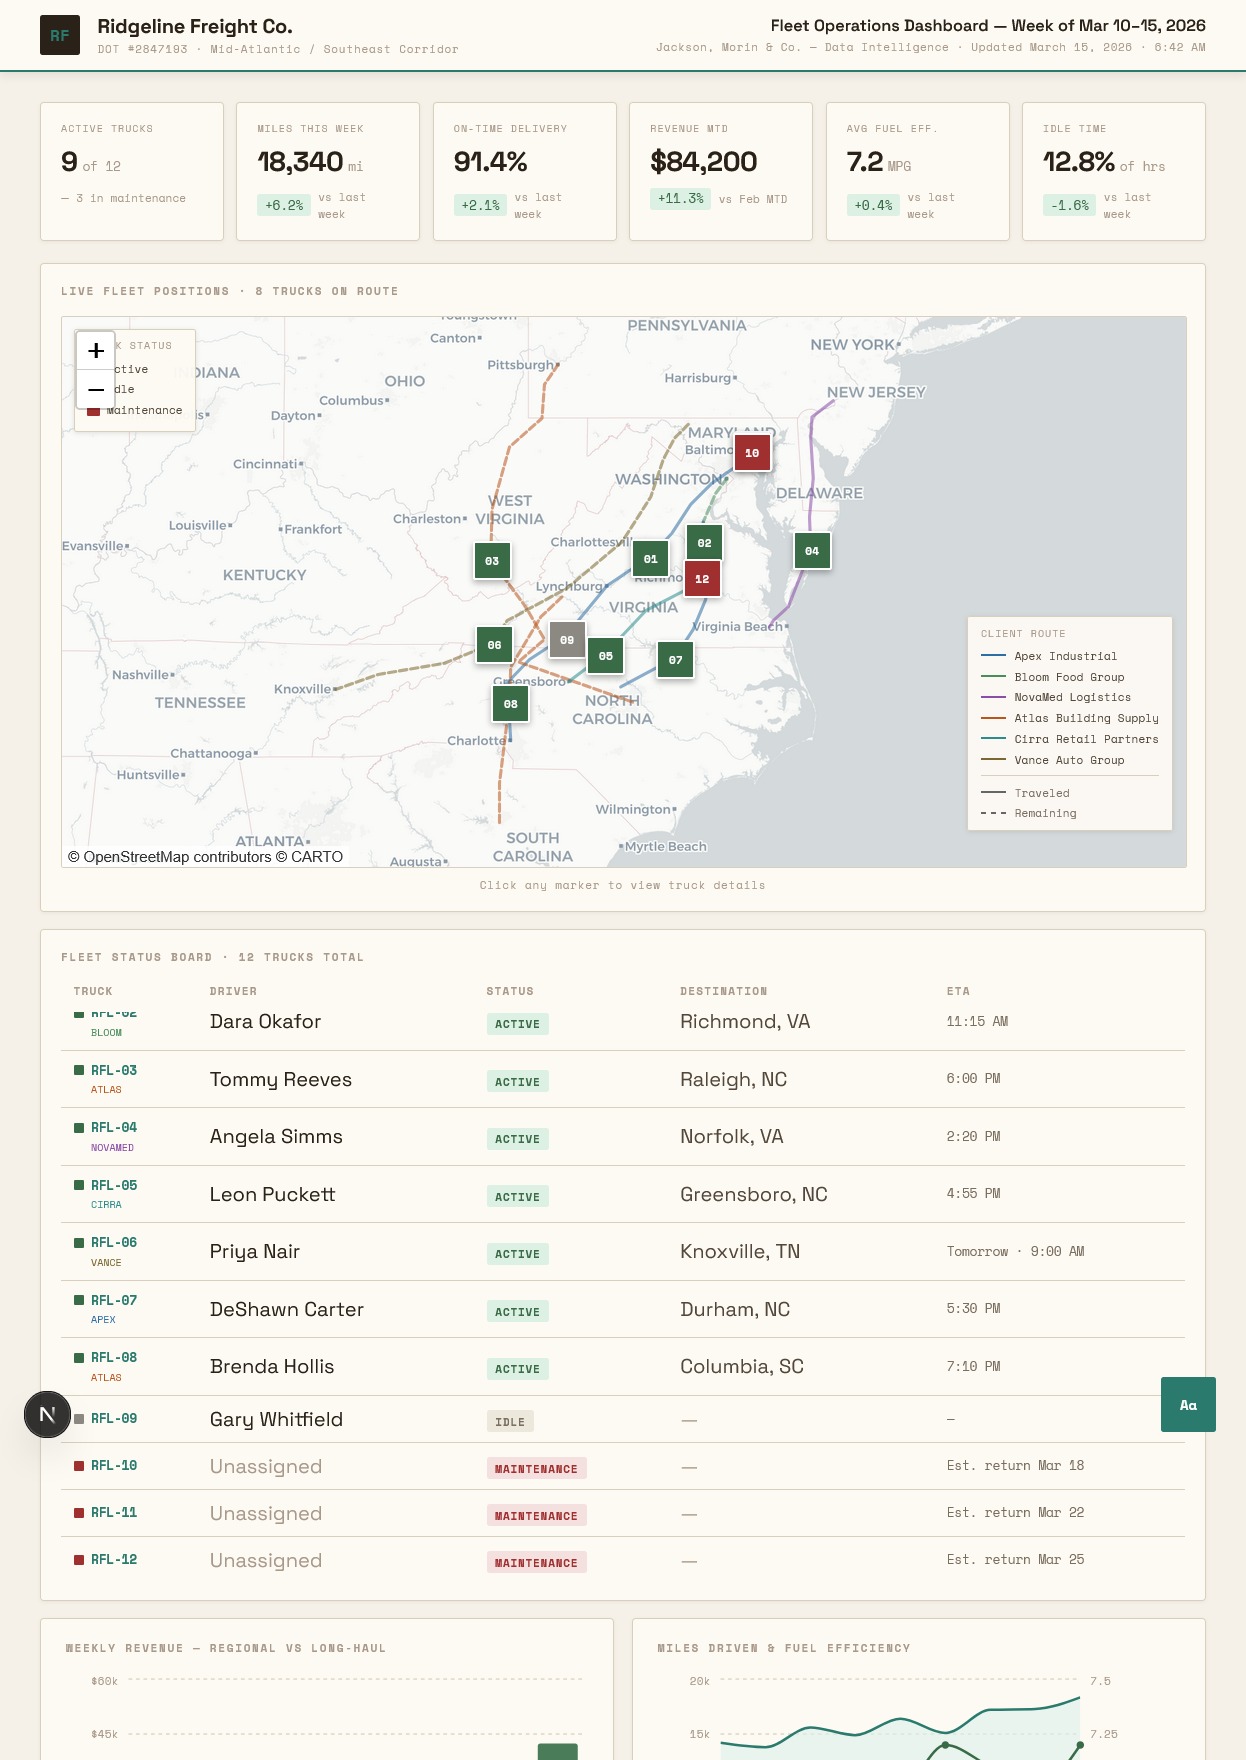
Whether you have a data problem, a systems problem, or just need to see what is actually happening in your business — we build the reporting layer from your actual data, your operational terminology, and your KPIs. Flight schools, freight operators, marinas, law firms, PE-backed portfolio companies. Connected live or updated monthly. The conversation is always free.